

Online Travel Marketing Statistics 2014

Image Credit: travelblat.com
Comscore-run recently did a studying showing the various statistics all related to traveling and the devices customers usually use to book or makes plans for their next vacation. If you considering a marketing plan for year 2015, here are some information you might want to keep in mind before launching any campaign.
Written Data:
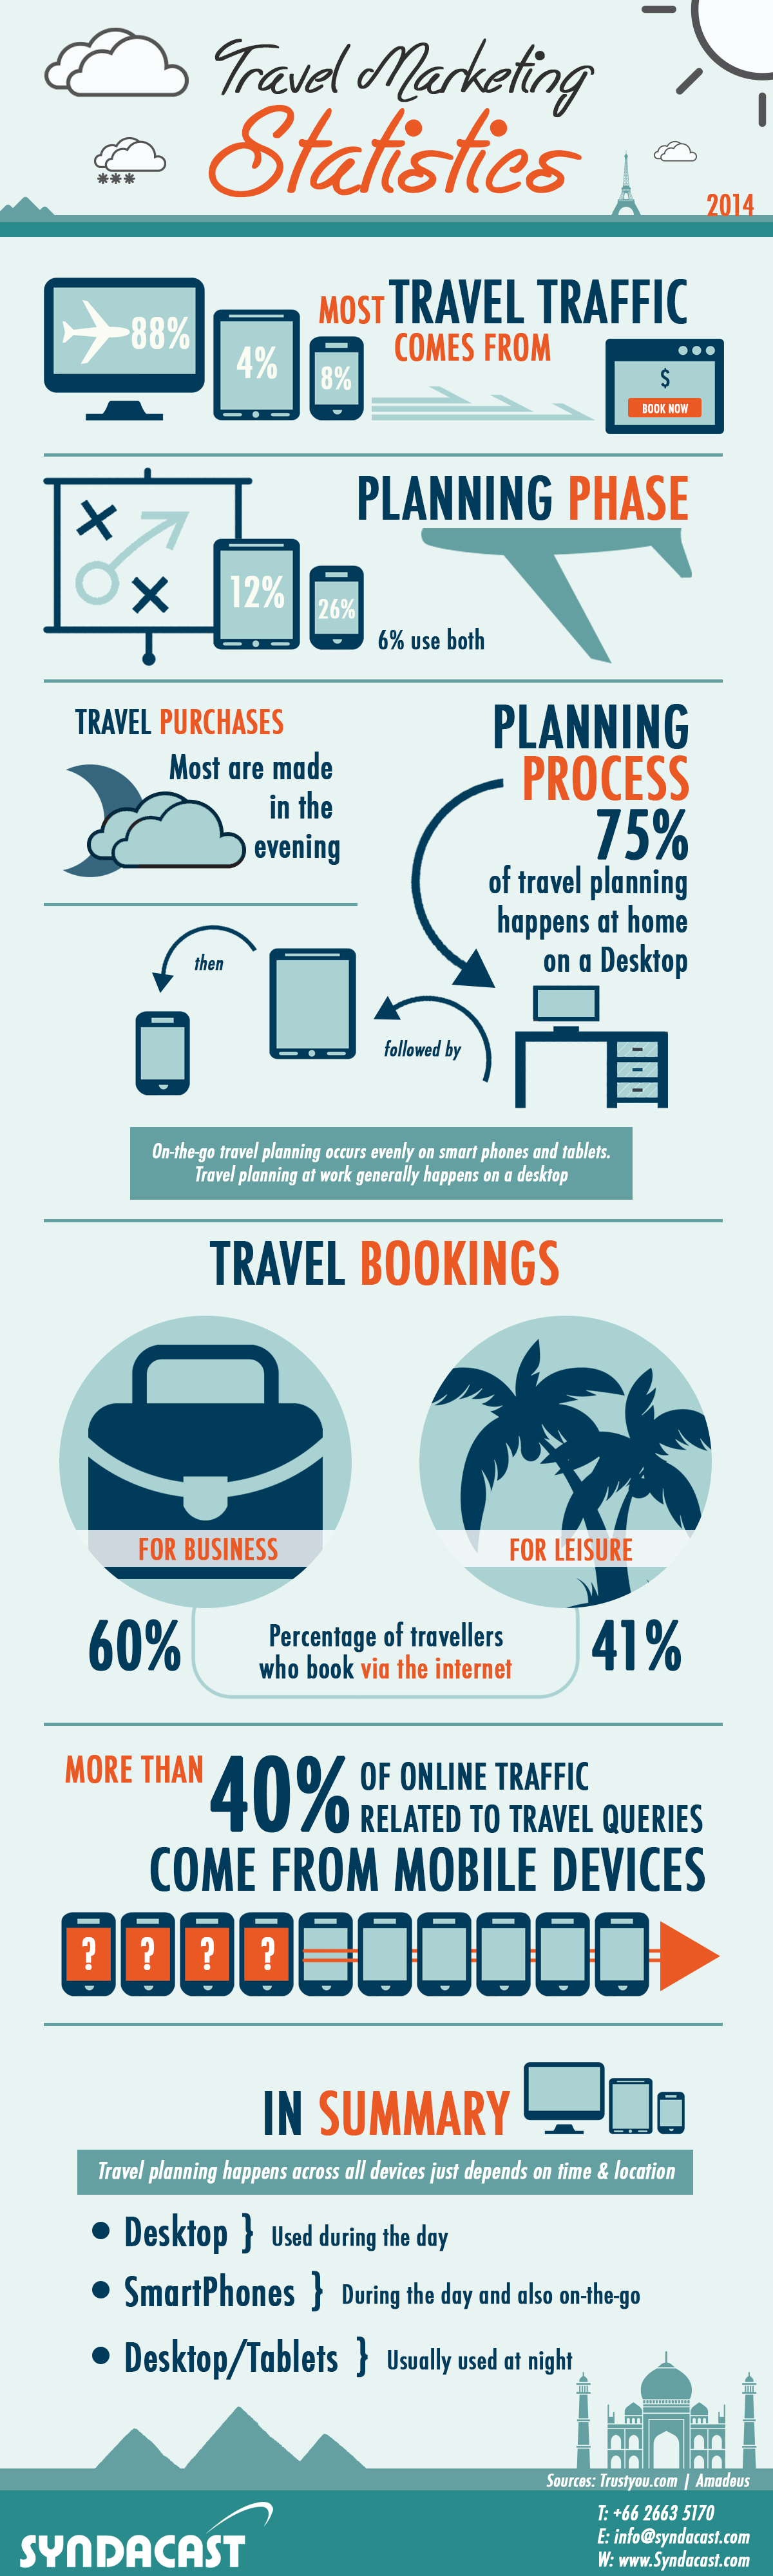
#Most travel traffic comes from:
Desktop 88%
Tablet 4%
Mobile 8%
#What devices people use when planning their trip
Tables 12%
Mobile 26%
#When to people purchase their travels
Most travel purchases are made the evening
#How to customer plan their travels
75% of travel planning happens at home on a Desktop followed by a tablet then mobile devices
On-the-go travel planning occurs evenly on smart phones and tablets. Travel planning at work generally happens on a desktop
#Travel bookings
60% of travelers who on via the internet are traveling for business
41% of travelers who on via the internet are traveling for leisure
#More than 40% of online traffic related to travel queries come from mobile devices
In Summary
Travel planning happens across all devices but just depends on time and location
Desktop – used mostly during the day
Smartphones – used during the day and also on-the-go
Desktop/Tablets – usually used at night
Sources: trustyou.com, amadeus.com